Data may drive business, but for many management teams, data is also difficult to read, analyze and understand in its raw form. Even data that is categorized and structured in databases can still be overwhelming and unwieldy to try to talk about in planning, strategy and organizational meetings.
To make things even more complex, in today’s world of big data, the data sets are so much larger. Instead of thousands of data points to consider, a company may be looking at hundreds of thousands. Even for those involved in working with the data on an ongoing basis, this can be confusing. For shareholders, potential investors or other interested parties, all of the data points can be simply background noise to a discussion.
Making Data “Doable”
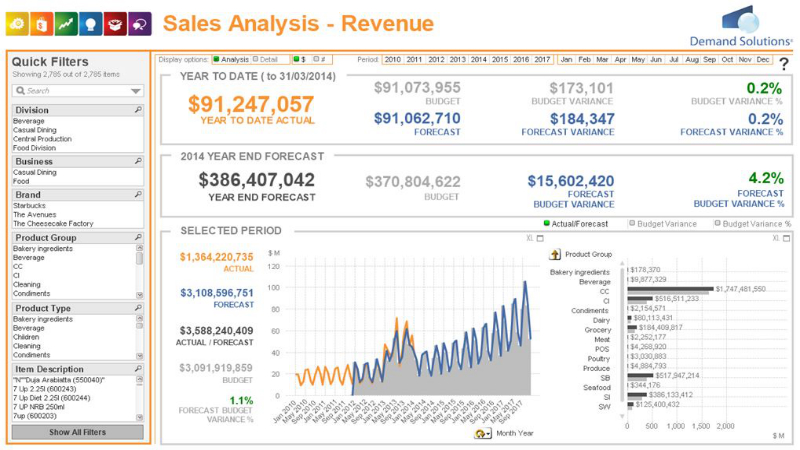
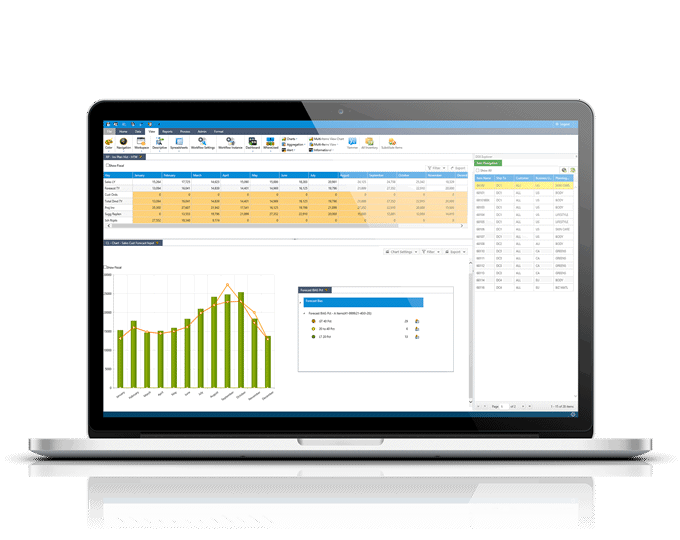
A way to address this issue is to convert those hundreds of thousands of data entries into a readable format. Through data visualization software, it is possible to create graphs, charts, maps, images and even animations to create a meaningful way to show trends, movements, changes, and information.
This is the difference in looking at a column of hundreds of numbers and glancing at a bar graph that makes it immediately evident that in 2018 the total sales were two times the sales in 2014.
It is also possible to pinpoint where in the company the efficiency is the highest, where it is the lowest or where the staff outperforms expectations. Literally, any information that can be gathered can be displayed through data visualization software.
This is being just about showing results. The use of data visualization software can include telling the story of a business, looking for trends that are developing in a business or across an industry, or looking for patterns within a market that can help with the next new product launch or business expansion.
Through the use of software that turns data into something manageable, everyone in the company will benefit. Providing a clear picture to everyone helps with corporate goals and also provides a clear picture to all involved in a meaningful and helpful format.


